Connect business data.
Build trust in every layer.
A transformation journey across two Singapore healthcare implementations: from SharePoint and Business Central data foundations to Materialized Lake Views and Power BI reporting.
From separate sources
to a shared data foundation.
Business information lives across ERP transactions and files maintained by operational teams. Bringing those sources together requires more than moving data: the team needs consistent definitions, repeatable processing and visibility when something fails.
My role connected business understanding with hands-on delivery. I implemented the Fabric foundation around a Medallion structure, with SharePoint and Dynamics 365 Business Central as source systems, and documented the engineering patterns in a seven-part article series.
Three layers. Clear responsibilities.
Source systems: SharePoint + Dynamics 365 Business Central. Fabric provides the structure for retaining source data, standardising it and preparing it for reporting.
Land source data with traceability. Repeatable file discovery and ingestion establish the starting point for downstream processing.
Apply mappings, data types and transformation rules. Check data quality so inconsistent inputs become visible.
Curate reporting tables and shared business logic, giving Power BI and analysis a common foundation.
Each layer has a purpose: preserve what arrived, make it understandable, then express what the business needs to measure.
A pipeline the team
can understand and support.
Repeatable ingestion and mapping
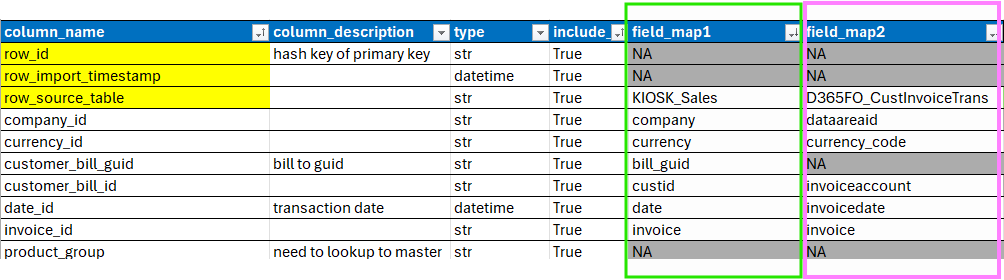
Metadata and readable mapping workbooks make source-to-target rules explicit. SharePoint file transfer reduces reliance on manual uploads, while the layered design separates ingestion from business transformation.
Coordinated execution
The published orchestration work addresses dependencies, notebook status and throttling. Independent work can run together; dependent stages wait for the data they need.
Visible quality and failures
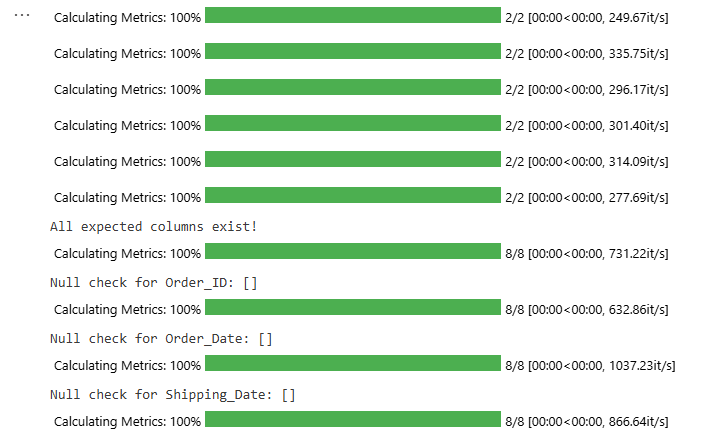
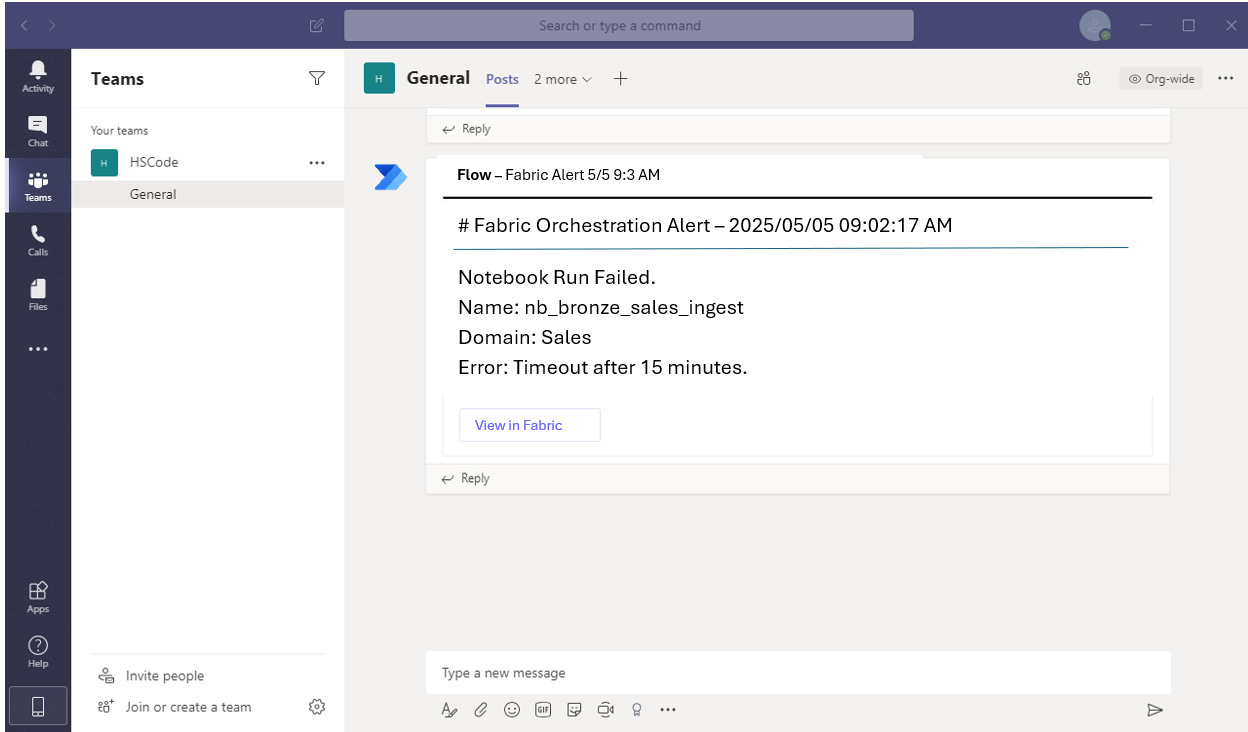
Validation checks expose missing fields, nulls and invalid values. Scheduled Power Automate checks turn failed-run logs into Teams notifications, making exceptions visible beyond the notebook.
Implementation thinking.
Visible working examples.
These screenshots come from my original articles. They show the mapping, validation and operational-notification patterns behind the work. Published examples are illustrative of the approach; they do not expose the client's datasets or demonstrate a Business Central connector.
A foundation for trusted reporting
and the next transformation.
This implementation brings ERP and file-based information into a common Fabric architecture. The Medallion structure gives the team a clear place to manage source data, transformations and business definitions; the supporting patterns make processing more repeatable and exceptions easier to see.
That is how I approach transformation engineering: connect the business need to a working platform, then make its behavior understandable to the people who operate it.
The article series also explores extensions such as persisted quality audit records and validation-based pipeline blocking. Those are design options, not additional delivery claims for this case.
Follow the implementation journey.
01Make ingestion repeatable
Metadata-led file discovery and loading into Bronze Delta tables.
Make mappings visible
Excel-defined field mappings, types and source traceability.
Connect SharePoint to Fabric
Automated file transfer using Microsoft Graph and scoped site access.
Coordinate Bronze, Silver and Gold
Dependency-aware notebook execution, status tracking and retry handling.
Make failures visible to the team
Scheduled Power Automate checks and Teams notifications for failed runs.
Check the quality of incoming data
Great Expectations checks demonstrated in a Fabric notebook.
Put shared business logic in Gold
Curated reporting tables and reusable SQL business definitions.
Extend the foundation.
Bring insight closer to the business.
In a separate Singapore healthcare engagement, I continued the Fabric journey with Materialized Lake Views (MLVs). The focus moved from establishing the data foundation to delivering a maintainable analytics layer.
MLVs organise transformations and reusable query logic over lake data.
Orchestration connects dependent processing stages with semantic-model refresh.
Gold-layer modelling and Power BI translate prepared data into reporting.
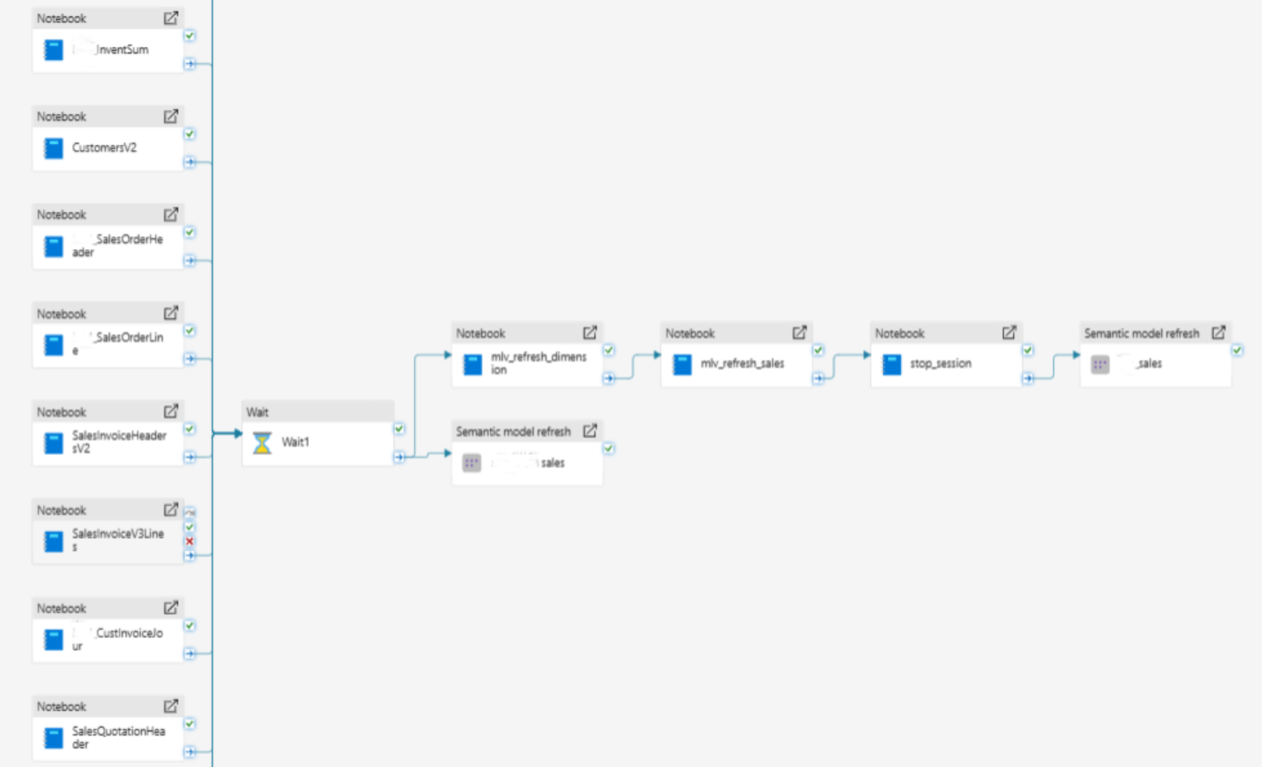
Monitoring adds visibility into refresh performance, latency and failures, helping teams assess the reliability of the information they use.
From data engineering
to a view the business can use.
The story ends at the decision surface: sales by origin and region, revenue and gross-profit trends, and top-customer analysis.
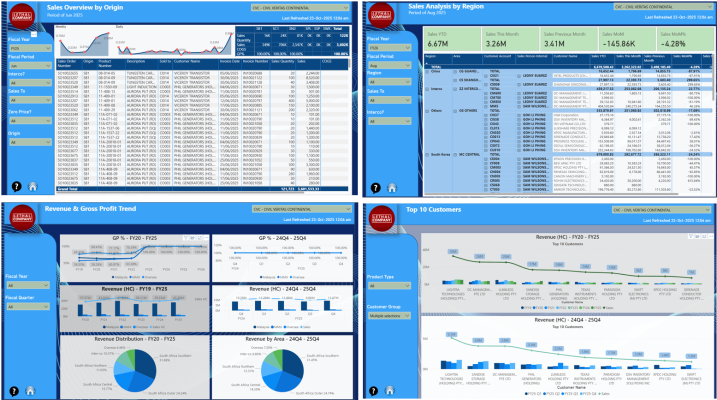
My role connects implementation choices to the people using the outcome—from a clear data foundation to understandable business reporting.